I used to operate a PUBG match analysis web app called Steins.GG. The service has since shut down.
PUBG is the game I have played the most in my life, and being able to run a site about it that reached more than 80,000 cumulative users was a really happy experience, so I am leaving this as a write-up.
Table of Contents
Open Table of Contents
- Things That Made Me Happy
- Things That Were Hard
- Technical Backstory from Here
Things That Made Me Happy
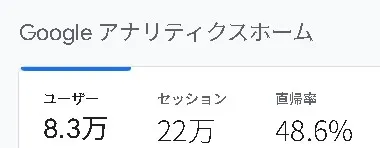
- More people used it than I had imagined (based on Google Universal Analytics)
- I could see people using steins.gg on social media every day, which made me really happy.
- I was able to get involved behind the scenes by supporting analysis for several professional teams.
- Because of that, I had more chances to talk directly with league players and became friendly with some of them.
Things That Were Hard
- The operating costs were heavier than I expected.
- Server costs were 3,500 yen per month.
- The
.ggdomain registration fee was around 17,000 yen in the first year, around 25,000 yen in the second year, and the price would keep increasing from the third year onward, so it hit hard for a free personal service.- This was the biggest reason I shut the service down.
- I had a policy of not adding ads.
- I thought ads were a trade-off against usability and site trust, and for
steins.ggI wanted to stick to “zero ads.”
- I thought ads were a trade-off against usability and site trust, and for
- As a result, there was no way to recover the fixed costs, which made it difficult to keep going.
- Keeping up with PUBG API specification changes and compatibility breaks, such as new or removed endpoints and response-structure changes.
- The mental ups and downs caused by changes in active users.
- Numbers moved a lot depending on patches, shifts in popular game modes, tournament seasons, and so on.
- Once I started wondering whether this web app was really useful, it often affected me mentally.
Technical Backstory from Here
Tech Stack
Frontend: PUBG Web App (steins.gg/pubg)
- jQuery 3.3.1 / jQuery UI
- Bootstrap 3
- Fabric.js
- Used for working with the Canvas API: map images plus circle, line, icon, and other overlay drawing.
- math.js
- Used for numeric processing such as deviation-score and vector calculations.
Backend / server side
- Nginx
- Served the PUBG Web App as static files.
- Connected WordPress to PHP through FastCGI.
- Reverse-proxied the Node.js API, which was an internal API service.
- PHP (FastCGI)
- Connected from Nginx through FastCGI.
- Runtime for WordPress, which published information about PUBG and other games.
- Node.js + Express (internal API service for the PUBG Web App)
- API server that fetched data from the PUBG API, transformed it for app use, and returned it.
Other
- ABLENET VPS
- Gonbei Domain
- Probably the only Japan-facing site where I could buy a
.ggdomain.
- Probably the only Japan-facing site where I could buy a
Design Points I Cared About
Designing and Operating the Server So It Would Go Down as Little as Possible
Before developing Steins.GG, I had released its predecessor, an app called 404system.
I ran it with the mindset of “let’s just make something that works,” but as a result it often went down when access concentrated during prime time, around the time after scrims.
The cause was simply temporary overload and memory pressure from too much access.
With Steins.GG, I made several changes to solve that.
Consolidating the Entry Point in Nginx
The only public ports were Nginx 80/443; the Node API and PHP (FastCGI) were closed to localhost and not exposed to public access.
This let me centralize TLS termination, access logs, and various limits, so I could reduce application-layer overload and security risk at a relatively low cost.
Multiprocess Workers
I used express-cluster to fork as many workers as there were CPU cores, with the goal of improving tolerance for concurrent requests.
The aim was to make it easier to increase throughput on a multicore environment compared with single-process Node.
Also, by leaving worker management to a library, I could keep implementation cost low while restarting crashed workers, which improved availability.
var cluster = require("express-cluster");

cluster(function (worker) {
  server.listen(port, host, () => {
    console.log(
      "Server running on " +
        host +
        " : " +
        port +
        " : with pid " +
        process.pid +
        " : with wid " +
        worker.id
    );
    server.on("error", onError);
    server.on("listening", onListening);
  });
});
I Did Not Want Official Tournament Data to Depend on an External API
Tournament data used a separate API for asset acquisition, and the data itself was static. Instead of fetching it again for every user request, I kept it as static data on the server side. That reduced unnecessary requests and data processing inside the server, and made the app easier to maintain.
It was a decision to cut the external dependency and choose speed and stability.
JSON loaded through Node.js require() is placed in the module cache, so repeated access inside the same process could return responses quickly.
One thing I was careful about was avoiding any violation of the PUBG API terms of use: instead of redistributing the acquired Telemetry Data as-is, I saved only the transformed results needed for steins.gg display.
Transforming Huge PUBG API Data Before Returning It to the Frontend
Telemetry Data is large, and if the server keeps handling the full raw data every time, processing becomes pretty heavy, especially during prime time when access is high.
So on the server side, I first normalized match metadata such as map and time, and returned to the frontend only the minimum information needed for display plus the Telemetry Data URL.
I separated responsibilities as: the server calls the matches endpoint, while Telemetry Data is fetched directly from the client depending on the use case, or fetched through the server and transformed.
Adding a Cache Layer
If the same input triggered the API repeatedly, every request would cause:
- another access to the external PUBG API
- another parse / transform / aggregation pass over the same JSON
That worsened latency, load on the external API, and tolerance for concurrent access.
So I added a cache layer with lru-cache. The official Usage Guide also recommends caching.
I made a wrapper like this:
const LRU = require("lru-cache");

function createAsyncLruCache({ maxEntries, ttlMs, slidingTtl = true }) {
  const cache = new LRU({
    max: maxEntries,
    maxAge: ttlMs,
    updateAgeOnGet: slidingTtl,
  });

  return async function cached(key, fetcher) {
    const hit = cache.get(key);
    if (hit !== undefined) return hit; // value or Promise

    const promise = (async () => fetcher())();
    cache.set(key, promise, ttlMs);

    try {
      const value = await promise;
      cache.set(key, value, ttlMs); // replace with value on success (TTL reset)
      return value;
    } catch (e) {
      cache.del(key); // do not cache failures
      throw e;
    }
  };
}
In the implementation, I used it like this. In the example below, if the match ID and platform are the same, the app can immediately return the same response no matter which user sends the request.
const cacheMatch = createAsyncLruCache({
  maxEntries: 5000,
  ttlMs: 10 * 60 * 1000, // 10 minutes
});

async function getMatchDataCached(matchId, pltfrm, getMatchData) {
  const key = `match:${pltfrm}:${matchId}`;
  return cacheMatch(key, () => getMatchData(matchId, pltfrm));
}
What I noticed while operating it was that with cluster (multiprocess workers), caches are per worker. If you want caching to work across processes, you need a shared cache such as Redis. At the time, I was still in my first year as a working adult, did not have the money to rent a bigger server, and did not have the room to run a separate Redis process or manage another server, so I gave up on that. A few years later, when I become rich someday and build an even more serious service, I would like to try you, Redis.
The Experience of Sharing Results as Images
From the beginning, I designed the app with a strong focus on letting users share analysis results and match records to social media with one click.
This satisfied each user’s desire to show off their match records, while also making those users act as promoters for Steins.GG.
Even without active marketing from me as the developer, I wanted the service to spread on its own through user posts and grow active users.
Users could share their daily personal results on social media, and community tournament organizers could create overall ranking images with one click.
Leaving Mathematical Processing to math.js
There were mainly two uses.
The first was that steins.gg had an original scoring system called a deviation score. It calculated that score from various pieces of information such as kills, assists, and damage.
As mentioned above, the app was designed with social sharing in mind, so I think the mechanism for calculating and displaying deviation scores worked quite well. There were also many social-media posts about deviation scores.
// Metric keys used to calculate deviation scores (standard scores)
var DEVIATION_KEYS = [
  "kills", // number of kills
  "DBNOs", // number of knockdowns
  "assists", // number of assists
  "damageDealt", // damage amount
  "timeSurvived", // survival time
  "maxkills", // maximum kills
];

function calcDeviationScores(players) {
  if (!players || players.length === 0) return players || [];

  var n = players.length;

  // For each metric, build the list of values for all players.
  var valuesByKey = DEVIATION_KEYS.map(function (key) {
    return players.map(function (player) {
      return player[key];
    });
  });

  // Mean μ: the baseline for calculating differences from the average.
  var avgs = valuesByKey.map(function (values) {
    return math.mean(values);
  });

  // Standard deviation σ: the denominator of the z-score.
  // If σ=0, everyone has the same value, so standardization is impossible;
  // treat it as 0 here and later fix the score at 50.
  var sds = valuesByKey.map(function (values) {
    var sd = math.std(values, "uncorrected"); // population standard deviation (divide by n); intended to use the in-match distribution as-is
    return isFinite(sd) && sd !== 0 ? sd : 0;
  });

  // z-score: z = (x - μ) / σ, converting difference from the mean into standard-deviation units.
  // Convert z linearly into a familiar scale centered on 50.
  for (var i = 0; i < n; i++) {
    var player = players[i];
    var deviations = DEVIATION_KEYS.map(function (key, j) {
      var sd = sds[j];
      if (!sd) return 50; // if σ=0, relative difference is undefined, so use the neutral value
      return (10 * (player[key] - avgs[j])) / sd + 50;
    });
    player.deviations = deviations;
    // Total deviation score: simple equal-weight sum.
    player.numdeviation = math.sum(deviations);
  }

  return players;
}
The second use was for drawing the flight path. This was necessary because the match object does not contain airplane route information, so I had to calculate it from player-location information in Telemetry Data using vectors. For tournament analysis, knowing which route the plane flew is extremely useful information, so I absolutely wanted to display it.
function getRoute(mapJSON) {
  var route = [];

  // From Telemetry Data, extract only the position logs for players riding the plane (TransportAircraft).
  // route = [p0, p1, ...], where p is {x,y,z}
  for (var i = 0; i < mapJSON.length; i++) {
    var e = mapJSON[i];
    if (
      e.vehicle &&
      e.character &&
      e.common &&
      e.common.isGame >= 0.1 && // 0 is the pre-takeoff starting-island log, so exclude it
      e.elapsedTime < 150 && // only early game: aim for the range right after takeoff while direction is stable
      e.vehicle.vehicleType === "TransportAircraft"
    ) {
      route.push(e.character.location);
    }
  }

  return route;
}

function drawRoute(route) {
  if (!route || route.length < 2) return;

  // We only want to estimate direction, so create it from an early point and the last point in the sequence.
  // v = pe - ps (difference vector)
  var startIndex = route.length > 2 ? 1 : 0; // the first point can be noisy, so the second point is often used

  // Scale to match drawing coordinates.
  var scale = 100;
  var ps = { x: route[startIndex].x / scale, y: route[startIndex].y / scale };
  var pe = {
    x: route[route.length - 1].x / scale,
    y: route[route.length - 1].y / scale,
  };

  var vx = pe.x - ps.x;
  var vy = pe.y - ps.y;

  // ||v||: vector length
  var len = math.sqrt(vx * vx + vy * vy);
  if (!len || !isFinite(len)) return;

  // u = v / ||v||: unit direction vector, extracting only the direction.
  var ux = vx / len;
  var uy = vy / len;

  // p' = pe + extend * u, extending the line slightly to make it easier to see.
  var extend = 50;
  var endX = pe.x + extend * ux;
  var endY = pe.y + extend * uy;

  renderRouteToCanvas(ps.x, ps.y, endX, endY);
}
If I Were to Build Something New Next Time, What Would I Do?
- Choose a domain that can be operated long-term.
- Renewal fees differ greatly depending on the TLD, so I would estimate operating costs before deciding.
- Use cloud managed services for the infrastructure to reduce operational load and fixed costs.
- Move the frontend toward static hosting.
- Scale the API with serverless or containers.
- Move drawing toward WebGL rather than Fabric.js (Canvas 2D).
- Canvas 2D basically depends on the CPU, so it tends to get heavy as object counts and redraws increase.
- WebGL is strong for large-volume drawing, zooming/panning, and layer compositing, so I would like to use GPU rendering while keeping implementation cost down with a 2D WebGL library such as
PixiJS.
- Prepare a way to recover operating costs, such as donations or ads.
![[PUBG] I Released Steins.GG, a Match Analysis System!](https://blog.devkey.jp/en/posts/release-steinsgg/index.png)
![[PUBG] My Experience Working as an Analyst for a Top-Division Pro Team](https://blog.devkey.jp/en/posts/my-pro-league-analyst-experience/index.png)
![[PUBG] I Revived the Steins.GG Match Analysis System as a Limited Release](https://blog.devkey.jp/en/posts/steinsgg-is-back/index.png)
![[PUBG] How to Create an API Key](https://blog.devkey.jp/en/posts/how-to-create-pubg-api-key/index.png)
![[PUBG] I Gave the Limited-Release Match Analysis System a Massive Update](https://blog.devkey.jp/en/posts/renewal-steinsgg/index.png)